Doppelgänging and Digital Forensic Analysis - Part Deux
Read Time: 15 Minutes
On 17th of December 2017, I wrote a blog post reacting to Blackhat 2017 EU presentation on a new Process Hollowing Technique named Doppelgänging. The original presentation from Blackhat (BH) EU 2017 can now be found on youtube to be seen it's full glory. At the time I did not have proof of concept (POC) code and just a day later Hasherzade wrote some POC code/blogged about it.

Leveraging his code I took a stab to see what I could find based on the observations I made in my blog post and leveraging current memory analysis techniques to see what other indicators I could spot. From my blog post I cited references from the original presentation, at BH EU 2017, that included looking at the windows executive object "FILE_OBJECT" and the attribute "ImageFilePointer". Also, I remarked that the NTFS $LogFile would give some valuable clues.
Looking at the "FILE_OBJECT" for the created Doppelgänging process post exploitation did not reveal the "WriteAccess" setting of "TRUE"(enSilo, 63). This brings me to a second point made by enSilo that the "...EPROCESS. ImageFilePointer is NULL (Win 10)"(enSilo, 63) which would not be applicable due to my use of Windows 7. Finally, I shared a reflection that the transaction $LogFile will be useful which did prove partially true during testing. An example of the data structure can be found here and more information regarding its function can be found in my original blog post.
The rest of this blog post will focus on interesting, and potentially reusable, observations I made. The following will outline how I present my observations and the TLDR on why it was interesting:
<snippit>
#include <Windows.h>
Using Volatility Framework's "handles" plugin I was able to extract the following fields from the log(note that pid 3300 is the real process and pid 3412 is the poc) :
Volatility Foundation Volatility Framework 2.5
Offset(V) Pid Handle Access Type Details
---------- ------ ---------- ---------- ---------------- -------
0x85a95c80 3412 0xc 0x100020 File \Device\HarddiskVolume2\Windows\System32
0x85716d50 3412 0x54 0x120089 File \Device\HarddiskVolume2\Windows\Fonts\StaticCache.dat
0x8661aa60 3412 0x9c 0x100001 File \Device\KsecDD
0x85235c98 3300 0x8 0x100020 File \Device\HarddiskVolume2\ProgramData\Microsoft\Windows\Start Menu\Programs\Accessories
0x852fee18 3300 0xc 0x100020 File \Device\HarddiskVolume2\Windows\winsxs\x86_microsoft.windows.gdiplus_6595b64144ccf1df_1.1.7601.23894_none_5c0be957a009922e
0x852adf80 3300 0x10 0x100020 File \Device\HarddiskVolume2\Windows\winsxs\x86_microsoft.windows.common-controls_6595b64144ccf1df_6.0.7601.18837_none_41e855142bd5705d
0x854960e0 3300 0x34 0x120089 File \Device\HarddiskVolume2\Windows\System32\en-US\calc.exe.mui
0x8519d3d8 3300 0xc4 0x120089 File \Device\HarddiskVolume2\Windows\Fonts\StaticCache.dat
0x854f43e0 3300 0xf0 0x100001 File \Device\KsecDD
The difference here is the lack of reference back to the original disk file within the file handles which can be seen for the legitimate process ID 3300.
In summary, for this particular POC the observations above apply. I look forward to validating this against other POCs that are in the wild.
Please leave comments below and I look forward to sharing more experiences that I have on the daily with my readership.
On 17th of December 2017, I wrote a blog post reacting to Blackhat 2017 EU presentation on a new Process Hollowing Technique named Doppelgänging. The original presentation from Blackhat (BH) EU 2017 can now be found on youtube to be seen it's full glory. At the time I did not have proof of concept (POC) code and just a day later Hasherzade wrote some POC code/blogged about it.

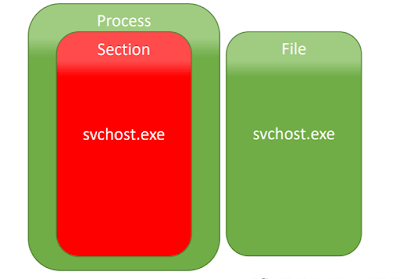
Figure 1: Doppelgänging Conceptual Model
Leveraging his code I took a stab to see what I could find based on the observations I made in my blog post and leveraging current memory analysis techniques to see what other indicators I could spot. From my blog post I cited references from the original presentation, at BH EU 2017, that included looking at the windows executive object "FILE_OBJECT" and the attribute "ImageFilePointer". Also, I remarked that the NTFS $LogFile would give some valuable clues.
Looking at the "FILE_OBJECT" for the created Doppelgänging process post exploitation did not reveal the "WriteAccess" setting of "TRUE"(enSilo, 63). This brings me to a second point made by enSilo that the "...EPROCESS. ImageFilePointer is NULL (Win 10)"(enSilo, 63) which would not be applicable due to my use of Windows 7. Finally, I shared a reflection that the transaction $LogFile will be useful which did prove partially true during testing. An example of the data structure can be found here and more information regarding its function can be found in my original blog post.
The rest of this blog post will focus on interesting, and potentially reusable, observations I made. The following will outline how I present my observations and the TLDR on why it was interesting:
- $LogFile - Contains all Transaction Information
- $UsnJrnl - Contains changes made to $MFT records
- _EPROCESS - Specifically the Parent Process ID and Process Environment Block
- _PEB_LDR_DATA - Specifically Size and Base for the process executable
- _Handle_TABLE - Specifically missing file handles
The results were produced by using the POC mentioned above with the following command line: "main.exe simple.exe C:\Windows\System32\calc.exe". "main.exe" is the POC compiled. The reference to "calc.exe" creates that appearance that calc.exe from the "C:\Windows\System32\" is loaded into memory. "simple.exe" is comprised of the following snippit of code:
<snippit>
#include <Windows.h>
#pragma comment(lib,"user32.lib");
int main()
{
MessageBox(0,"Message body", "Message title", MB_OK );
}
<snippit>
This code snippit is loaded into memory instead of the code at calc.exe creating this evasion condition described in the presentation.
1. $LogFile
For this section I exported the $LogFile from the disk using AccessData's FTKLite and processed the file with mft2csv project's LogFile_Parser. This file contains instructions on what to do forwards, or backwards, so roll back is possible:
Figure 1: $LogFile after Hasherzade Doppelgänging POC
This behavior was consistent no matter how the POC was used.
2. $UsnJrnl
Using Volatility Framework's "usnparser" plugin I was able to extract the following fields from the log:
timestamp, MFTEntry, MFTEntryUSN, Parent, ParentUSN, usn#, Filename, and Reason. Resulting in the following consistently using the POC:
Figure 1: $USNFile after Hasherzade Doppelgänging POC
3. _EPROCESS
Using Volatility Framework's "psinfo" plugin I was able to extract the following fields from the memory structure:
<snippit1>
Volatility Foundation Volatility Framework 2.5
Process Information:
Process: calc.exe PID: 3300
Parent Process: explorer.exe PPID: 1232
Creation Time: 2018-02-12 19:49:37 UTC+0000
Process Base Name(PEB): calc.exe
Command Line(PEB): "C:\Windows\system32\calc.exe"
VAD and PEB Comparison:
Base Address(VAD): 0x470000
Process Path(VAD): \Windows\System32\calc.exe
Vad Protection: PAGE_EXECUTE_WRITECOPY
Vad Tag: Vadm
Base Address(PEB): 0x470000
Process Path(PEB): C:\Windows\system32\calc.exe
Memory Protection: PAGE_EXECUTE_WRITECOPY
Memory Tag: Vadm
Similar Processes:
C:\Windows\system32\calc.exe
calc.exe(3300) Parent:explorer.exe(1232) Start:2018-02-12 19:49:37 UTC+0000
C:\Windows\System32\calc.exe
calc.exe(3412) Parent:NA(3976) Start:2018-02-12 17:52:12 UTC+0000
Suspicious Memory Regions:
0x77e50000(No PE/Possibly Code) Protection: PAGE_EXECUTE_WRITECOPY Tag: Vad
---------------------------------------------------
</snippit1>
<snippit2>
Process Information:
Process: calc.exe PID: 3412
Parent Process: NA PPID: 3976
Creation Time: 2018-02-12 17:52:12 UTC+0000
Process Base Name(PEB): calc.exe
Command Line(PEB): C:\Windows\System32\calc.exe
VAD and PEB Comparison:
Base Address(VAD): 0x400000
Process Path(VAD): \Users\IEUser\Desktop\process_doppelganging-master\calc.exe
Vad Protection: PAGE_EXECUTE_WRITECOPY
Vad Tag: Vad
Base Address(PEB): 0x400000
Process Path(PEB): C:\Windows\System32\calc.exe
Memory Protection: PAGE_EXECUTE_WRITECOPY
Memory Tag: Vad
Similar Processes:
C:\Windows\System32\calc.exe
calc.exe(3412) Parent:NA(3976) Start:2018-02-12 17:52:12 UTC+0000
C:\Windows\system32\calc.exe
calc.exe(3300) Parent:explorer.exe(1232) Start:2018-02-12 19:49:37 UTC+0000
Suspicious Memory Regions:
0x77e50000(No PE/Possibly Code) Protection: PAGE_EXECUTE_WRITECOPY Tag: Vad
---------------------------------------------------
</snippit2>
In "snippit2" we see the POC in use and what is noteworthy is the following:
1. The Command Line is not in quotes for the POC.
2. The Parent Process ID remains intact for the legitimate process seen in snippit1.
3. The Base Address is different between what should be identical processes.
4. _PEB_LDR_DATA
Using Volatility Framework's "dlllist" plugin I was able to extract the following fields from the memory structure InLoadOrderModuleList for the POC(Snippit2) and the legitimate application(Snippit1):
<snippit1>
calc.exe pid: 3300
Command line : "C:\Windows\system32\calc.exe"
Service Pack 1
Base Size LoadCount Path
---------- ---------- ---------- ----
0x00470000 0xc0000 0xffff C:\Windows\system32\calc.exe
0x77bf0000 0x142000 0xffff C:\Windows\SYSTEM32\ntdll.dll
0x76b60000 0xd5000 0xffff C:\Windows\system32\kernel32.dll
0x75d80000 0x4b000 0xffff C:\Windows\system32\KERNELBASE.dll
0x75eb0000 0xc4c000 0xffff C:\Windows\system32\SHELL32.dll
0x77d80000 0xac000 0xffff C:\Windows\system32\msvcrt.dll
0x77240000 0x57000 0xffff C:\Windows\system32\SHLWAPI.dll
0x76b10000 0x4e000 0xffff C:\Windows\system32\GDI32.dll
0x77a70000 0xc9000 0xffff C:\Windows\system32\USER32.dll
0x76b00000 0xa000 0xffff C:\Windows\system32\LPK.dll
0x76d00000 0x9d000 0xffff C:\Windows\system32\USP10.dll
0x74670000 0x191000 0xffff C:\Windows\WinSxS\x86_microsoft.windows.gdiplus_6595b64144ccf1df_1.1.7601.23894_none_5c0be957a009922e\gdiplus.dll
0x772a0000 0x15d000 0xffff C:\Windows\system32\ole32.dll
0x77b40000 0xa2000 0xffff C:\Windows\system32\RPCRT4.dll
0x778b0000 0xa1000 0xffff C:\Windows\system32\ADVAPI32.dll
0x77d40000 0x19000 0xffff C:\Windows\SYSTEM32\sechost.dll
0x77960000 0x91000 0xffff C:\Windows\system32\OLEAUT32.dll
0x74810000 0x40000 0xffff C:\Windows\system32\UxTheme.dll
0x74990000 0x19e000 0xffff C:\Windows\WinSxS\x86_microsoft.windows.common-controls_6595b64144ccf1df_6.0.7601.18837_none_41e855142bd5705d\COMCTL32.dll
0x6d670000 0x32000 0xffff C:\Windows\system32\WINMM.dll
0x75090000 0x9000 0xffff C:\Windows\system32\VERSION.dll
0x77d60000 0x1f000 0x4 C:\Windows\system32\IMM32.DLL
0x77400000 0xcd000 0x2 C:\Windows\system32\MSCTF.dll
0x74360000 0x131000 0x1 C:\Windows\system32\WindowsCodecs.dll
0x744d0000 0x13000 0x1 C:\Windows\system32\dwmapi.dll
0x759f0000 0xc000 0x1 C:\Windows\system32\CRYPTBASE.dll
0x76f00000 0x83000 0x1 C:\Windows\system32\CLBCatQ.DLL
0x6d570000 0x3c000 0x1 C:\Windows\system32\oleacc.dll
</snippit1>
<snippit2>
calc.exe pid: 3412
Command line : C:\Windows\System32\calc.exe
Service Pack 1
Base Size LoadCount Path
---------- ---------- ---------- ----
0x00400000 0x16000 0xffff C:\Windows\System32\calc.exe
0x77bf0000 0x142000 0xffff C:\Windows\SYSTEM32\ntdll.dll
0x76b60000 0xd5000 0xffff C:\Windows\system32\kernel32.dll
0x75d80000 0x4b000 0xffff C:\Windows\system32\KERNELBASE.dll
0x77a70000 0xc9000 0xffff C:\Windows\system32\USER32.dll
0x76b10000 0x4e000 0xffff C:\Windows\system32\GDI32.dll
0x76b00000 0xa000 0xffff C:\Windows\system32\LPK.dll
0x76d00000 0x9d000 0xffff C:\Windows\system32\USP10.dll
0x77d80000 0xac000 0xffff C:\Windows\system32\msvcrt.dll
0x77d60000 0x1f000 0x2 C:\Windows\system32\IMM32.DLL
0x77400000 0xcd000 0x1 C:\Windows\system32\MSCTF.dll
0x6e120000 0x3000 0x2 C:\Windows\system32\api-ms-win-core-synch-l1-2-0.DLL
0x778b0000 0xa1000 0x1 C:\Windows\system32\ADVAPI32.dll
0x77d40000 0x19000 0x4 C:\Windows\SYSTEM32\sechost.dll
0x77b40000 0xa2000 0x3 C:\Windows\system32\RPCRT4.dll
0x74810000 0x40000 0x2 C:\Windows\system32\uxtheme.dll
0x744d0000 0x13000 0x1 C:\Windows\System32\dwmapi.dll
0x772a0000 0x15d000 0x1 C:\Windows\system32\ole32.dll
0x759f0000 0xc000 0x1 C:\Windows\System32\CRYPTBASE.dll
************************************************************************
</snippit2>
This module shows based on load order what modules are associated with the process. The first module is always the process itself, and comparing the two outputs, which is a different size/entry point for execution. These should always be the same since clearly both are showing that the process allegedly executed from the same location and file.
5. _HANDLE_TABLE
Using Volatility Framework's "handles" plugin I was able to extract the following fields from the log(note that pid 3300 is the real process and pid 3412 is the poc) :
Volatility Foundation Volatility Framework 2.5
Offset(V) Pid Handle Access Type Details
---------- ------ ---------- ---------- ---------------- -------
0x85a95c80 3412 0xc 0x100020 File \Device\HarddiskVolume2\Windows\System32
0x85716d50 3412 0x54 0x120089 File \Device\HarddiskVolume2\Windows\Fonts\StaticCache.dat
0x8661aa60 3412 0x9c 0x100001 File \Device\KsecDD
0x85235c98 3300 0x8 0x100020 File \Device\HarddiskVolume2\ProgramData\Microsoft\Windows\Start Menu\Programs\Accessories
0x852fee18 3300 0xc 0x100020 File \Device\HarddiskVolume2\Windows\winsxs\x86_microsoft.windows.gdiplus_6595b64144ccf1df_1.1.7601.23894_none_5c0be957a009922e
0x852adf80 3300 0x10 0x100020 File \Device\HarddiskVolume2\Windows\winsxs\x86_microsoft.windows.common-controls_6595b64144ccf1df_6.0.7601.18837_none_41e855142bd5705d
0x854960e0 3300 0x34 0x120089 File \Device\HarddiskVolume2\Windows\System32\en-US\calc.exe.mui
0x8519d3d8 3300 0xc4 0x120089 File \Device\HarddiskVolume2\Windows\Fonts\StaticCache.dat
0x854f43e0 3300 0xf0 0x100001 File \Device\KsecDD
In summary, for this particular POC the observations above apply. I look forward to validating this against other POCs that are in the wild.
Please leave comments below and I look forward to sharing more experiences that I have on the daily with my readership.
References
- Peter Staarfanger, "Doppelgänging and Digital Forensic Analysis". https://digitalfirstresponse.blogspot.com/2017/12/doppelganging-and-memory-forensics.html
- enSilo "Lost In Transaction Process Doppelganging" https://www.blackhat.com/docs/eu-17/materials/eu-17-Liberman-Lost-In-Transaction-Process-Doppelganging.pdf
- enSilo "enSilo Webinar Recording Process Doppelgangin December2017". https://www.youtube.com/watch?v=Cch8dvp836w
- Hasherzade. "About Me". https://about.me/hasherezade
- Hasherzade. "My implementation of enSilo's Process Doppelganging (PE injection technique)". https://github.com/hasherezade/process_doppelganging
- Hasherzade. "Process Doppelgänging – a new way to impersonate a process". https://hshrzd.wordpress.com/2017/12/18/process-doppelganging-a-new-way-to-impersonate-a-process/
- ForensicInsight. "NTFS Log Tracker". http://forensicinsight.org/wp-content/uploads/2013/06/F-INSIGHT-NTFS-Log-TrackerEnglish.pdf
- Google Code. "Mft2CSV". https://code.google.com/archive/p/mft2csv/
- AccessData. "FTK Lite". http://marketing.accessdata.com/ftkimagerlite3.1.1
- Tom Spencer. "usnparser". https://raw.githubusercontent.com/tomspencer/volatility/master/usnparser/usnparser.py
- Monnappa22. "psinfo". https://github.com/monnappa22/Psinfo
- Volatility Foundation. "Volatility Framework wiki". https://github.com/volatilityfoundation/volatility/wiki/Command-Reference#dlllist
- Volatility Foundation. "Volatility Framework wiki". https://github.com/volatilityfoundation/volatility/wiki/Command-Reference#handles


Comments
Post a Comment